
With summer winding down and families settling back into school, Baldwin County's housing market saw a lack of urgency this August.
Baldwin REALTORS Multiple Listing Service (MLS) reports …
This item is available in full to subscribers.
Please log in to continue |
With summer winding down and families settling back into school, Baldwin County's housing market saw a lack of urgency this August.
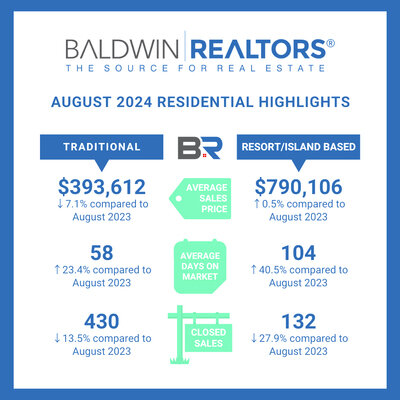
Baldwin REALTORS Multiple Listing Service (MLS) reports significant year-over-year increases from August 2023 to August 2024 in average days on market for both the traditional residential and resort areas of Baldwin County real estate, meaning listings across the county typically stayed in active status longer before going under contract. Additionally, total closed sales decreased across both submarkets in comparison with the year prior.
For August 2024, the resort area of Baldwin County (all of Orange Beach, Fort Morgan and anything in Gulf Shores south of Canal Road/180) saw average sales prices increase by 0.5% from August 2023, resulting in an average of $790,106. Listings spent more time on the on market at an average of 104 days, compared to 74 days the year prior. A decrease was reported in total closed sales as 132 properties solid in August 2024, compared to 183 in August 2023.
Baldwin County's traditional residential area (everything else in Baldwin County not included in the resort market areas) saw average sales prices decrease by 7.1% from August 2023, resulting in $393,612. Properties stayed on market longer with an average of 58 days, which is 11 more days than the average a year ago. Total closed sales for this area of the county reports a loss of 67 properties from the previous year at 430 properties sold.
Central Baldwin
Coastal condos
• Residential properties sold in August 2024: 82
• Average sales price: $722,700
• Average days on market: 109
Coastal homes
Eastern Shore
North Baldwin


