
The pace of the real estate market in Baldwin County continues to operate at a slower speed than recent years. Baldwin REALTORS® Multiple Listing Service (MLS) reports a year-over-year increase …
This item is available in full to subscribers.
Please log in to continue |
The pace of the real estate market in Baldwin County continues to operate at a slower speed than recent years.
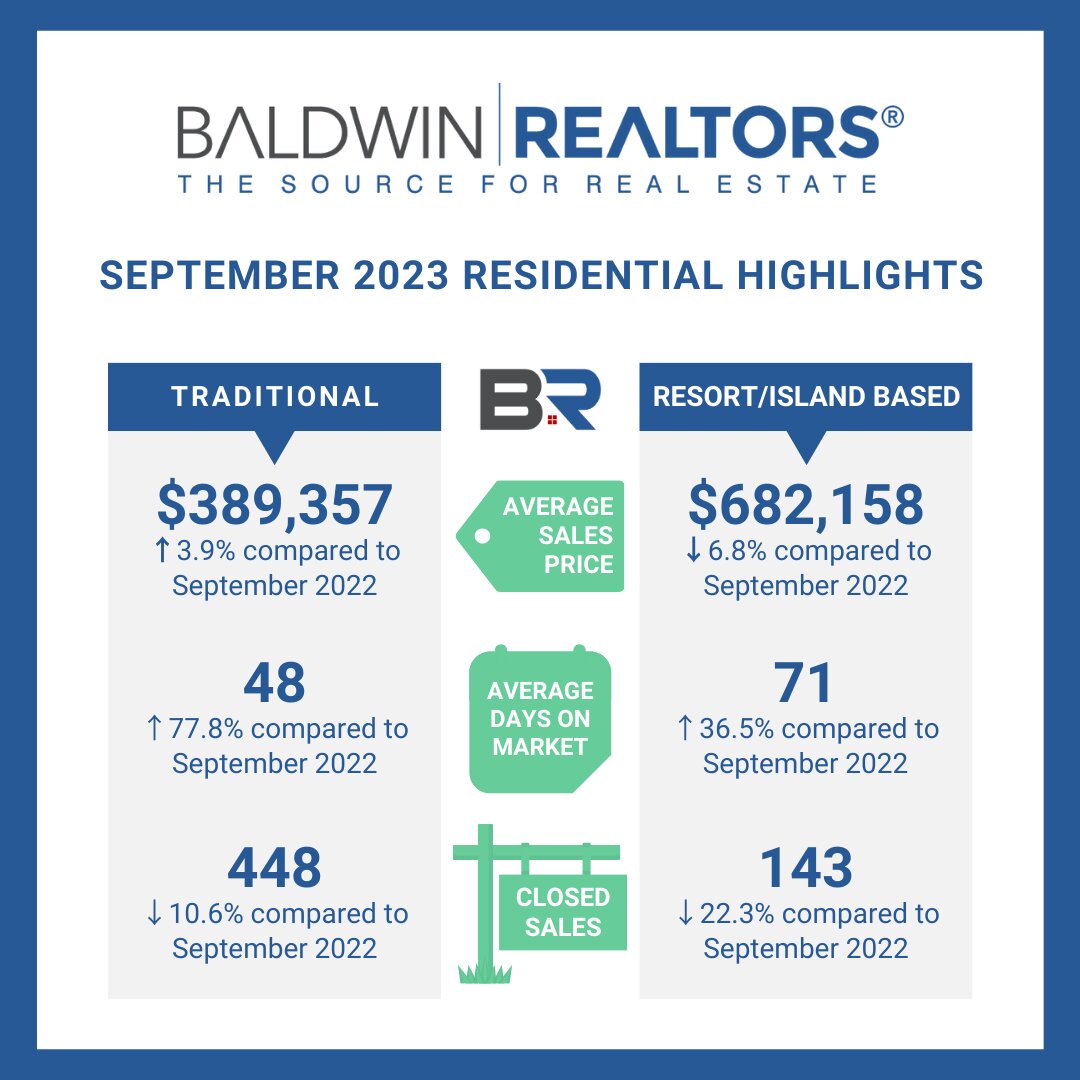
Baldwin REALTORS® Multiple Listing Service (MLS) reports a year-over-year increase for September 2023 in average days on market (DOM) and a decrease in the number of closed sales for both traditional residential and resort/island-based properties in the county. Additionally, the traditional residential properties in the county continued to see slight average sales price increases, while the resort/island-based properties experienced a minor dip in sold prices.
In the resort area of Baldwin County (all of Orange Beach, Fort Morgan and anything in Gulf Shores south of Canal Road/180), average sales price saw a 6.8% decrease from September 2022, resulting in an average of $682,158. Listings spent more time on the on market at an average of 71 days, compared to 52 days the year prior. A decrease was reported in total closed sales as 143 properties solid in September 2023, compared to 184 in September 2022.
In Baldwin County's traditional residential area, average sales price experienced a 3.9% increase from September 2022 at $389,357. Properties stayed on market longer with an average of 48 days, which is 21 more days than the average a year ago. There were 16 less new listings and 53 less properties sold in this area of the county than last year.
Central Baldwin
Coastal condos
Coastal homes
Eastern Shore
North Baldwin


